"LXLUa��03 简介:
FRED作为COM组件可以实现与Excel、VB、
Matlab等调用来完成庞大的计算任务或画图,本文的目的是通过运行一个案例来实现与Matlab的相互调用,在此我们需要借助脚本来完成,此脚本为视为通用型脚本。
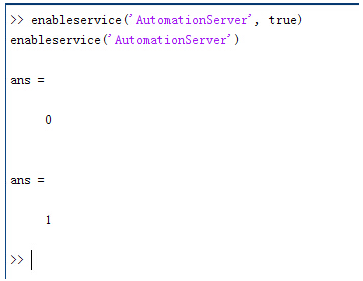
@YW�fq$�23 }��wj*�^>* 配置:在执行调用之前,我们需要在Matlab命令行窗口输入如下命令:
�� /�=�[�M enableservice('AutomationServer', true)
`d3S0N�6@� enableservice('AutomationServer')
v`x�~��O+  ��][wS}~):
 结果输出为1,这种操作方式保证了当前的Matlab实体可以用于
通信。
� v+G}�n\F .�B#L�t,m� 在winwrp界面,为增加和使用Matlab类型的目录库,我们需要如下步骤:
��!Me��%W3 1. 在FRED脚本编辑界面找到参考.
?v�f�\_R'M 2. 找到Matlab Automation Server Type Library
\+�L_'*&�8 3. 将名字改为MLAPP
fBw+Y4nCO7 VJ�HHC.Kz� ~LYKt0/W&� 在Matlab里面有两种常用的数据发送选项PutWorkspaceData 及PutFullMatrix,PutWorkspaceData适用于存储一般的数据在工作区,并赋予其为变量,PutFullMatrix试用于复数数据。
�'�{6`n5:e 图 编辑/参考
|W*f��6�F3 xH�3S�Vn(I �Er{[�83
� 现在将脚本代码公布如下,此脚本执行如下几个步骤:
T7cT4��PAW 1. 创建Matlab服务器。
��ecf<(Vl} 2. 移动探测面对于前一聚焦面的位置。
J�R7~|��ov 3. 在探测面追迹
光线 Y��n1�U@�! 4. 在探测面计算
照度 W,AI��E�6F 5. 使用PutWorkspaceData发送照度数据到Matlab
��,,BNUj/: 6. 使用PutFullMatrix发送标量场数据到Matlab中
�
s�.GTY@t 7. 用Matlab画出照度数据
w��[4S�u�D 8. 在Matlab计算照度平均值
�s/P\w"/fN 9. 返回数据到FRED中
0#Rj[J;�kh ?ADk`ts~,} 代码分享:
-cq ~\m^�6 �PM�Xnupt� Option Explicit
�7^|�3T�TK '*�-X���3p Sub Main
*x��L#��1 K7e<hdP_�# Dim ana As T_ANALYSIS
:*c@6;2�@� Dim move As T_OPERATION
u�$<FK�p;I Dim Matlab As MLApp.MLApp
DgOoEH�y[ Dim detNode As Long, detSurfNode As Long, anaSurfNode As Long
&[RC�4^;\V Dim raysUsed As Long, nXpx As Long, nYpx As Long
B*DH^�";t Dim irrad() As Double, imagData() As Double, reals() As Double, imags() As Double
L=HL1Qe$G] Dim z As Double, xMin As Double, xMax As Double, yMin As Double, yMax As Double
xW�"J@OiKL Dim meanVal As Variant
�/_j�Ap�Zz /0SP�Rf}�p Set Matlab = CreateObject("Matlab.Application")
V�!FzVl=G� E8NIH!�d�I ClearOutputWindow
jX+L�����I jN5Sc0�|b� 'Find the node numbers for the entities being used.
�d��F1B�o� detNode = FindFullName("Geometry.Screen")
\?�q�Xs�cq detSurfNode = FindFullName("Geometry.Screen.Surf 1")
8�
LaZ5��� anaSurfNode = FindFullName("Analysis Surface(s).Analysis 1")
��-P'>~W,~ �zq1&MXR)l 'Load the properties of the analysis surface being used.
{-�1�7;M�$ LoadAnalysis anaSurfNode, ana
��6{+~B2Ef k"Sw,"e>+� 'Move the detector custom element to the desired z position.
-�*�yj[�?6 z = 50
*q8�W;Wa�L GetOperation detNode,1,move
7*[>e7�:A move.Type = "Shift"
pF"z��)E|^ move.val3 = z
DO(
/,A<{8 SetOperation detNode,1,move
#�NL��1N_B Print "New screen position, z = " &z
c1��:op@t� Y|B�/(��� 'Update the model and trace rays.
@uH�7GW}$g EnableTextPrinting (False)
]���/�d2*# Update
��J�w
{:1� DeleteRays
e,1Jxz4Q�H TraceCreateDraw
>���O\-\�L EnableTextPrinting (True)
Pv0OoN*eJ{ ]�]�`+aF0� 'Calculate the irradiance for rays on the detector surface.
09x�\i/nb� raysUsed = Irradiance( detSurfNode, -1, ana, irrad )
Bwll
[=_�I Print raysUsed & " rays were included in the irradiance calculation.
VQo7�se1�P �4r5,kOFWb 'When using real number data to send to MATLAB, it is simplest to use PutWorkspaceData.
Y{p �*�$ Matlab.PutWorkspaceData("irradiance_pwd","base",irrad)
oM�M�U5sm� 2�]�4�R`[# 'PutFullMatrix is more useful when actually having complex data such as with
�"Ny�_��RF 'scalar wavefield, for example. Note that the scalarfield array in MATLAB
1bj75/i<6� 'is a complex valued array.
.�!9]I'9�M raysUsed = ScalarField ( detSurfNode, -1, ana, reals, imags )
A�KA�A�b~{ Matlab.PutFullMatrix("scalarfield","base", reals, imags )
*�O ���0�* Print raysUsed & " rays were included in the scalar field calculation."
7U�j[0Awn� s0nihX1Z- 'Calculate plot characteristics from the T_ANALYSIS structure. This information is used
�?58pkg� J 'to customize the plot figure.
_0vXuj��z xMin = ana.posX+ana.AcellX*(ana.Amin-0.5)
�E176O[(V= xMax = ana.posX+ana.AcellX*(ana.Amax+0.5)
�Wm3H6o�*� yMin = ana.posY+ana.BcellY*(ana.Bmin-0.5)
R��b�r��vY yMax = ana.posY+ana.BcellY*(ana.Bmax+0.5)
possM�'vC� nXpx = ana.Amax-ana.Amin+1
� ^��5�;�Y nYpx = ana.Bmax-ana.Bmin+1
<F=j6U7
�� DI�$z�yj~3 'Plot the data in Matlab with some parameters calculated from the T_ANALYSIS
E+��7S:B�� 'structure. Set the axes labels, title, colorbar and plot view.
C %EQ9Iq6r Matlab.Execute( "figure; surf(linspace("&xMin &","&xMax &","&nXpx &"),linspace("& yMin &"," & yMax & "," & nYpx & "),irradiance_pwd, 'EdgeColor', 'None');" )
}.T$bj1B;V Matlab.Execute( "xlabel('X Position (" & GetUnits() & ")')" ) : Matlab.Execute( "ylabel('Y Position (" & GetUnits() & ")')" ) : Matlab.Execute( "zLabel( 'Irradiance' )" )
h�c[GpZcw, Matlab.Execute( "title('Detector Irradiance')" )
CZ&TUE|:DA Matlab.Execute( "colorbar" )
wkd591d�* Matlab.Execute( "view(2)" )
a�Mz%�H|/$ Print ""
!J:�DBtGT Print "Matlab figure plotted..."
gV`�:e�No* �&�V�o�nu* 'Have Matlab calculate and return the mean value.
YD�QV�,`S7 Matlab.Execute( "irrad = mean(mean(irradiance_pwd));" )
9��r8�{9h: Matlab.GetWorkspaceData( "irrad", "base", meanVal )
<�edAWc�+� Print "The mean irradiance value calculated by Matlab is: " & meanVal
~��Q]B}qdm L;z-,U$;%R 'Release resources
�c�6lEW�C: Set Matlab = Nothing
aa".��d[*1 z5{I3� Y!1 End Sub
3\'.1���p q��c`_&!*D 最后在Matlab画图如下:
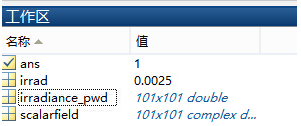
�CMF1�<A4] Ws1<Jt3/." 并在工作区保存了数据:
%NAz�(��B  OI`Lb\8pP�
 并返回平均值:
�]gm�f%g'C v�-Br�)lLv 与FRED中计算的照度图对比:
L50`,,��WF �FS@�SC`~( 例:
�+ S%+�Ku� ,*�%8�*]<= 此例
系统数据,可按照此数据建立
模型 <`N\FM^�vo 3�����P��J 系统数据
�{+r?g���J ��f0^s�*V+ chi�Q+���� 光源数据:
N.�isvDk�% Type: Laser Beam(Gaussian 00 mode)
tSO�F7N/<� Beam size: 5;
��}�~� �+� Grid size: 12;
a�}O�v��@7 Sample pts: 100;
=�)bZSb"<" 相干光;
�
�NOQgkN� 波长0.5876微米,
R�i-I+7(n! 距离原点沿着Z轴负方向25mm。
�ga�,y�Fw� �TY8��8PXW 对于执行代码,如果想保存图片,请在开始之前一定要执行如下代码:
�o��86}NqK enableservice('AutomationServer', true)
[S<DdTY9hZ enableservice('AutomationServer')